Visitor Analytics Dashboard
Traffic trends, peak hours heatmaps, visitor type breakdowns, and facility comparisons. Schedule reports to your inbox or export to CSV.
Key Capabilities
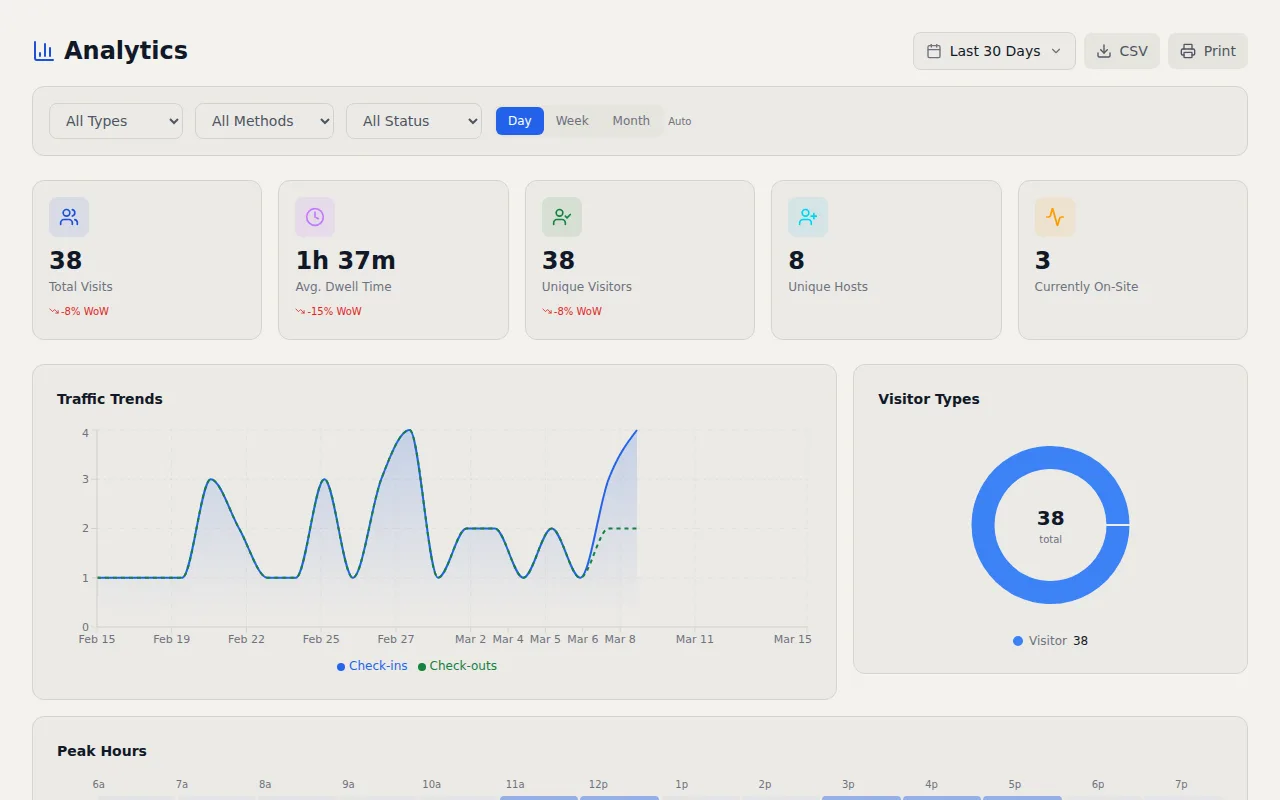
- Traffic Trends — Daily, weekly, and monthly visitor volume with interactive charts
- Peak Hours Heatmap — Hourly visitor distribution to plan staffing and security
- Visitor Breakdowns — Filter by visitor type, reason, company, or host
- Facility Comparison — Compare visitor volumes across all locations
- Scheduled Reports — Automated reports delivered by email on any cadence
- CSV Export — Export visitor data for compliance reporting or external tools
How It Works
A visitor log that only tells you who is in the building right now is leaving value on the table. The patterns hidden in your visitor data tell you when to staff the front desk, which facilities get the most traffic, what types of visitors drive the most volume, and whether your check in process is scaling with your business. I built the visitor analytics dashboard to surface those insights without requiring a data analyst or a separate BI tool.
Traffic trends display daily, weekly, and monthly visitor volumes with interactive charts. Zoom into a single week to spot anomalies or zoom out to a full year to identify seasonal patterns. If visitor counts dropped 30% last month, you will see it instantly. The peak hours heatmap breaks down visitor arrivals by hour and day of the week, giving you a visual grid that makes staffing decisions obvious. If your heatmap shows a consistent spike on Tuesday mornings between 9am and 11am, you know that is when your lobby needs extra coverage. Security teams use the same heatmap to plan guard shifts around actual visitor patterns instead of guessing.
Visitor type breakdowns let you filter data by visitor category (contractor, client, vendor, interviewee, or custom types), reason for visit, company name, or host. Want to know how many contractors visited your manufacturing facility last quarter? One filter and you have the answer. Facility comparison puts all your locations side by side on a single dashboard so you can see which buildings are handling the most traffic and allocate resources accordingly. For organizations with ten or twenty locations, this comparison view replaces the tedious process of pulling individual reports from each site.
For stakeholders who want reports delivered without logging into the dashboard, scheduled reports run on a daily, weekly, or monthly cadence and arrive by email. Each report includes visitor counts, trend data, and the key metrics for that period. A COO can get a weekly summary every Monday morning without ever opening the application. CSV export is available for any date range or filter combination, which makes it straightforward to feed visitor data into external tools, compliance reports, or executive presentations. The analytics work with both visitor management and hospitality mode, so whether you are tracking building access or restaurant guest traffic, the same dashboard adapts to your data. No third party analytics tool required.
Frequently Asked Questions
Can I schedule visitor reports to arrive by email?
What does the peak hours heatmap show?
Can I compare visitor traffic across multiple facilities?
Related Features
Visitor Management Audit Trail
Every visitor action logged with timestamps, IP addresses, and user attribution. Immutable records that map to CMMC 2.0, NIST 800 171, HIPAA, ISO 27001, FedRAMP, and PCI DSS controls.
Visitor Management API
A full REST API with bearer token auth, scoped permissions, and webhooks that fire on every check in and checkout. Integrate VisitorLog with anything.
Visitor Notification System
Real time email and SMS notifications the instant a visitor checks in or out. Custom templates, daily digests, checkout reminders, and host approval by text reply.
Try it free
No credit card, no trial period. Create your account and start managing visitors in minutes.